Monitoring
Read the coverage monitoring dashboard
Use geographic filters, summary indicators, map layers and data tables to understand programme coverage.
- Signed in to the correct programme
- Access to Coverage Tracking → Dashboard
Follow these steps
Open the dashboard and allow it to load
Under Coverage Tracking, select Dashboard. The map and indicators may take a few moments to load, especially on a slower connection.
Set the geographic scope
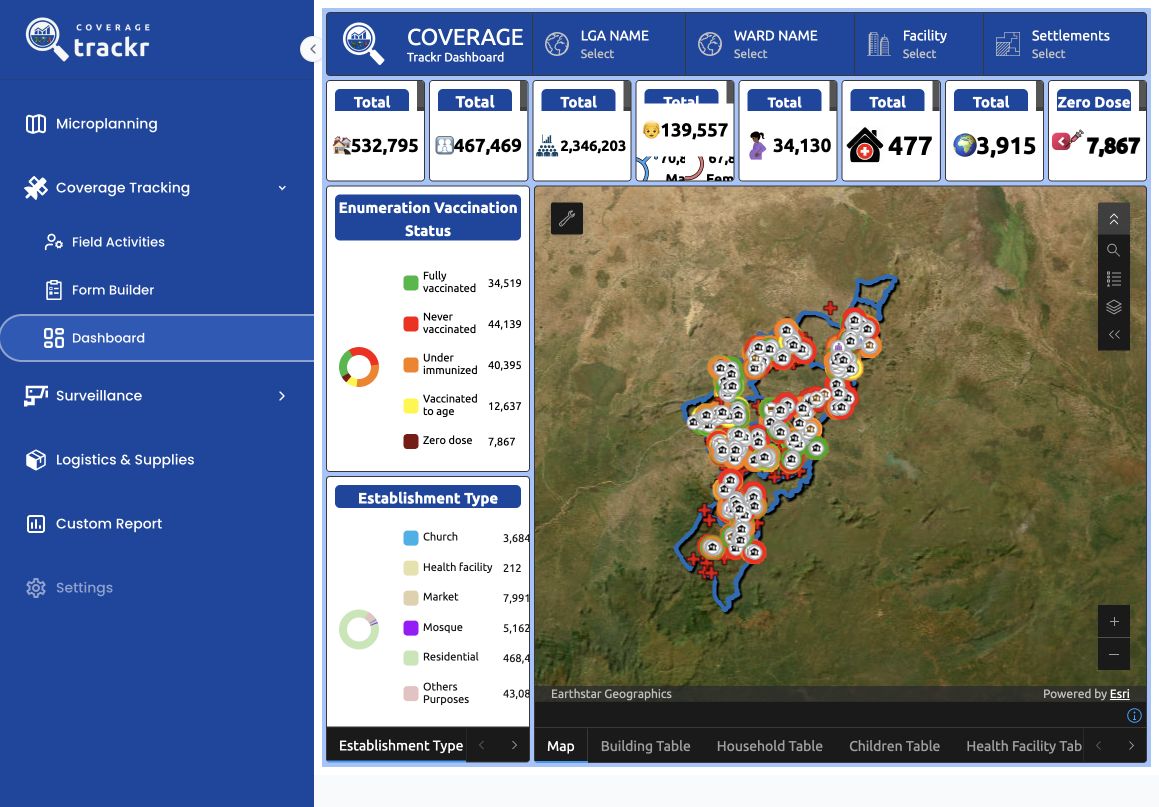
Use the LGA Name, Ward Name, Facility and Settlements selectors across the top. Start with the broadest level and move to a narrower level so each selector reflects the preceding choice.
Read the summary indicators
The cards across the top provide headline totals. Read each label together with its value and confirm the selected geography before comparing figures or reporting them.
Interpret vaccination status
Use the Enumeration Vaccination Status legend to compare categories such as fully vaccinated, never vaccinated, under-immunised, vaccinated to age and zero dose. The legend colours correspond to the dashboard visualisation.
Explore the map
Use the map controls to zoom and inspect the selected area. Map symbols and coloured outlines represent locations and status information; use the legend as the reference when interpreting them.
Review the supporting tables
Use the tabs along the bottom—Map, Building Table, Household Table, Children Table and Health Facility Table—to move from the geographic overview to supporting records.
Note: Dashboard results reflect the selected programme and filters. Record those selections when sharing a figure so others can reproduce it.
You can filter the dashboard and interpret the headline coverage and operational indicators.
If something goes wrong
The dashboard remains blank or shows loading indicators.
Wait for the map and cards to finish loading. If they remain blank, check the connection, reload the page and confirm that the selected programme contains dashboard data.
A lower-level location cannot be selected.
Choose the preceding geographic level first—for example, select an LGA before selecting a Ward.